
If you’re researching how to start a trash can cleaning business, one question comes up almost immediately:
How many cans can you actually clean in a day?
The honest answer is: it depends!
Your daily production depends on route density, equipment, travel time, the number of cans at each stop, customer access, wastewater handling, and how much of your schedule consists of recurring versus one-time work.
A dense neighborhood route can dramatically outperform a larger route spread across three cities. That’s why smart operators focus on revenue per route hour, not just the biggest possible can count.
Let’s break down the numbers in a practical way.
Cans, Stops, and Route Days Are Different Metrics
Before discussing capacity, we need to define the terms.
- A can is one trash or recycling container cleaned.
- A stop is one customer location.
- A route day is the complete workday, including driving, setup, cleaning, customer communication, breaks, maintenance, and disposal logistics.
One customer stop might include one can. Another might include two, three, or more cans.
That means cleaning 40 cans could mean:
- 40 customers with one can each
- 20 customers with two cans each
- 10 customers with four cans each
Those are very different workdays!
When planning your trash can cleaning route, track both:
- Completed stops per day
- Completed cans per day
The formula is simple:
Cans per day = completed stops per day × average cans per stop
If you complete 30 stops and average 1.5 cans per stop, you clean approximately 45 cans. That’s much more useful than saying you completed “30 jobs.”
This is also where pricing gets interesting. Many residential bin-cleaning companies do not price every job the same way. Some price per stop with up to two cans included. Others price per can. That means a 45-stop day could represent 45 cans, 70 cans, or up to 90 cans depending on the households, the route, and your pricing structure.
So yes, operators should absolutely track:
- Stops per day
- Cans per day
- Average cans per stop
Those three numbers work together. They affect workload, water usage, service time, and gross revenue planning.
How Long Does a Trash Can Cleaning Stop Take?
For recurring residential service, a standard stop generally takes approximately 3–5 minutes for the cleaning itself and normal stop process in the operating examples we use.
That is a helpful starting point, but it is not a promise!
Your actual time may increase because of:
- Multiple cans at one address
- Heavy grease, food waste, or organic buildup
- Long hose or equipment positioning
- Difficult access
- Cans stored behind gates or beside houses
- Customer instructions
- Weather
- Moving cans into position
- Water refills
- Wastewater recovery and disposal
- Photos, notes, or service documentation
One-time cleanings often take approximately 2–5 minutes longer than recurring stops because they may require extra buildup removal, additional passes, more customer communication, or unusual access.
The 3–5 minute figure helps explain the potential of the equipment. It does not mean an operator can simply multiply five minutes by an eight-hour day and expect the result. That would only measure theoretical cleaning time.
A real day includes everything around the cleaning.
Realistic Illustrative Capacity Scenarios
There is no universal daily number for every bin cleaning business. However, these planning bands can help you build an initial estimate.
Dense recurring neighborhood route
A tightly grouped residential route with mostly standard cans, short drives, and predictable access can absolutely outperform a scattered route. But let’s make this crystal clear: very few operators should plan around 100 residential stops in a day.
For many legitimate mobile residential operators, approximately 35 stops per day is a more realistic average planning benchmark. Some operators plan around 35–40 stops per day when routes are efficient and pricing supports it. Once you start pushing into 45+ residential stops, the day can become physically demanding in a hurry unless the route is exceptionally dense, well organized, and low on drive time.
That is an illustrative planning framework, not a guarantee. The big advantage of a dense route is simple: you spend more time cleaning and less time driving.
Spread-out or low-density route
A route covering multiple towns, rural areas, or widely separated neighborhoods may produce approximately 25–60 cans per day, depending on the market and service mix.
You may clean fewer cans, but that doesn’t automatically mean the route is bad. If your average ticket is higher, the route may still produce strong revenue per hour.
The problem is not always low can count. The problem is unpaid windshield time!
One-time-heavy route
One-time residential cleanings commonly take longer than standard recurring stops. A route focused on one-time work may produce approximately 15–40 cans in a day, depending on soil level, access, and driving distance.
One-time jobs often command a higher price per can, so fewer cans can still create a productive day. That said, one-time work is typically less predictable than recurring service.
Bulk or yard-cleaning project
Bulk and yard-cleaning work is a completely different animal from a normal residential route day.
A waste hauler, municipality, property manager, apartment community, HOA, or other large customer may have a bulk project involving 100 cans, but that does not mean 100 cans are being cleaned in one ordinary residential route day. Residential route planning is usually based on stops, while bulk-job planning is usually based on cans, staffing, handling, and project logistics.
As a planning reference, approximately 200–300 cans per day may be a reasonable example range for many bulk-cleaning situations, depending on:
- Equipment
- Staffing
- Wash-bay versus mobile conditions
- Container condition
- Handling requirements
- Water and wastewater logistics
- Travel
- Workday length
Those are still examples, not guarantees.
An experienced operator may report somewhat more in a wash-bay environment, and we’ve already noted examples around 350 bins in a shift. But wash-bay production is not directly comparable to mobile residential routes because driving, curbside setup, and neighborhood travel are reduced.
A 100-can project is best viewed as a small illustrative project, not a daily production assumption for regular residential routing.
A few more practical examples:
- A 100-can project may fit within a smaller scheduled job.
- A 1,000-can project at roughly 200–300 cans per day may require about 4–5 production days before accounting for setup, weather, travel, staffing, or other delays.
- A 10,000-can project would require multiple weeks or multiple crews depending on the agreed schedule, staffing plan, equipment capacity, water access, wastewater handling, and project coordination.
Viking Upfit has seen operators handle projects involving approximately 10,000 cans, but those are large projects completed over time with real planning behind them, not one-day production expectations.
Bulk work generally prices lower per can, often around $8–$15 per can, but it can fill route gaps and create substantial project revenue.
Illustrative Gross Revenue Examples
The following examples use the operating price ranges provided for this industry. They are gross revenue illustrations only, not profit projections.
Just as important, actual pricing structure varies by market and operator. Some companies price per stop, some price per can, and some use a hybrid model.
Per Stop vs. Per Can Pricing
Per-stop pricing
With per-stop pricing, one service price covers the stop and may include up to two standard residential cans, with an additional charge for a third or additional can.
This can make customer pricing simple and predictable. It also means a stop is not always equal to one can.
For example:
- 1 stop might include 1 can
- 1 stop might include 2 cans
- 1 stop might include 2 included cans plus an extra-can charge
That matters a lot when planning route revenue and workload.
Per-can pricing
With per-can pricing, the customer is charged based on the number of cans cleaned.
This may be useful when:
- Household quantities vary significantly
- You handle more commercial work
- You perform bulk or yard cleaning
- You want pricing to track production more directly
In that model, the math is straightforward because revenue rises with each additional can cleaned.
Hybrid pricing
A hybrid model combines both approaches.
For example:
- A base stop price includes one or two cans
- Additional cans are billed with an added per-can charge
A lot of operators like this because it keeps the offer simple while still protecting revenue when a stop includes more work.
Bulk or yard cleaning
Example based on cans and project pricing
If a smaller project includes 100 cans at $8–$15 per can:
- 100 cans × $8 = $800 gross
- 100 cans × $15 = $1,500 gross
That is best understood as a small illustrative project example, not a normal residential route-day assumption.
For larger bulk jobs, the math is still based on cans and project pricing, not residential stops. For example, a 1,000-can project priced at $8–$15 per can could represent $8,000–$15,000 gross, but actual completion time depends on production pace, staffing, wash-bay versus mobile setup, water, wastewater handling, travel, and scheduling.
Monthly recurring service
This category is where the difference between stops and cans really matters.
Example based on stops
If a business charges approximately $25–$40 per monthly stop with up to two cans included:
- 100 stops × $25 = $2,500 gross
- 100 stops × $40 = $4,000 gross
That represents the monthly route cycle, not $2,500–$4,000 every day.
But here’s the key point: 100 stops does not necessarily equal 100 cans. If up to two cans are included at each stop, those 100 stops could represent up to 200 cans before additional-can charges.
Example based on cans
If pricing is approximately $25–$40 per can per monthly cleaning:
- 100 cans × $25 = $2,500 gross
- 100 cans × $40 = $4,000 gross
Again, this represents the monthly service cycle.
Quarterly recurring service
The same distinction applies here.
Example based on stops
If a business charges approximately $40–$65 per quarterly stop with up to two cans included:
- 100 stops × $40 = $4,000 gross
- 100 stops × $65 = $6,500 gross
In that case, 100 stops could represent up to 200 included cans, depending on how the operator structures the offer and how many cans each household actually has.
Example based on cans
If pricing is approximately $40–$65 per can per quarterly cleaning:
- 100 cans × $40 = $4,000 gross
- 100 cans × $65 = $6,500 gross
Again, this revenue is collected over the quarterly service period.
One-time residential cleaning
One-time work can also be priced either way, depending on the market and operator.
Example based on cans
For 20 cans at approximately $50–$120 per can:
- 20 cans × $50 = $1,000 gross
- 20 cans × $120 = $2,400 gross
That is straightforward per-can math.
Example based on stops
If an operator instead prices one-time service by stop, then the total depends on:
- How many stops are on the route
- How many cans are included per stop
- Whether extra cans are billed separately
That is exactly why tracking average cans per stop matters so much.
One-time pricing can be attractive, but those jobs may take longer and require more individualized service.
Experienced-Operator Revenue Benchmark
Here’s a very practical benchmark from experienced operators: many legitimate residential bin-cleaning companies target approximately 35–40 residential stops per day, with average revenue around $30–$60 per stop.
That is gross revenue before expenses, and it assumes the operator actually completes those stops and maintains that average throughout the working period.
Just as important, that $30–$60 average per stop can come from different pricing structures:
- A stop price with one or two cans included
- A per-can model converted into a stop average
- A mixed route with different customer types or service frequencies
So before you do the math, define your pricing model first. Otherwise, you can end up comparing apples to lug nuts!
It is also important to keep the relationship between stop count and average revenue per stop realistic. Higher average revenue per stop may pair with fewer stops, not more. So while 35–40 stops is still a common legitimate daily target range, that does not mean every operator should expect to run 40 stops at $60 per stop.
Simple Annualized Planning Example
Using a simple 5-day workweek and 52 weeks for planning:
| Stops/day | Average revenue/stop | Daily gross | Weekly gross | Annualized gross |
|---|---|---|---|---|
| 35 | $30 | $1,050 | $5,250 | $273,000 |
| 25 | $60 | $1,500 | $7,500 | $390,000 |
That creates an illustrative annual gross-revenue planning range of approximately $273,000–$390,000.
Again, that is not a promise, and it is definitely not a guaranteed or typical outcome for every operator. Those lower and upper figures simply combine the planning endpoints. Actual revenue may fall anywhere within or outside that range depending on:
- Pricing structure
- Route density
- Average cans per stop
- Cancellations
- Weather
- Seasonality
- Holidays
- Total workdays
- Customer retention
- Route mix
Real-World Multi-Truck Planning Example
One established operator with multiple trucks has shared a planning goal with Viking Upfit of approximately 35 stops per day at an average of $35 per stop.
Using the same simple 5-day, 52-week planning method:
- 35 stops/day × $35/stop = $1,225/day gross
- $1,225/day × 5 days = $6,125/week gross
- $6,125/week × 52 weeks = $318,500 annualized gross
That $318,500 annualized gross figure is a real-world benchmark shared with Viking Upfit for planning purposes, not a guarantee. The bigger takeaway is that this operator’s multi-truck growth shows how a consistent target can be used for planning, route management, and expansion over time.
We also recommend building a more conservative version of the plan using 48–50 working weeks, not automatically assuming all 52 weeks produce full route output.
And of course, gross revenue is not profit. You still need to subtract:
- Equipment payments
- Labor
- Fuel
- Insurance
- Water
- Wastewater disposal
- Maintenance
- Marketing
- Software
- Taxes
- Payment processing
- Other overhead
That’s where real business planning begins.
Gross revenue is not profit. It does not include equipment payments, labor, fuel, insurance, water, wastewater disposal, maintenance, taxes, payment processing, marketing, software, or other overhead.
Why Recurring Routes Usually Build the Strongest Foundation
Most successful routes are built around recurring customers.
Recurring service is typically:
- Easier to predict
- Faster to perform
- Easier to schedule
- More consistent for customer communication
- Better for route density
- More useful for planning labor and equipment
- More likely to create stable monthly or quarterly revenue
A recurring customer may already understand where to leave the can, when the service occurs, and what the cleaning includes. That removes friction from the route.
One-time work still has an important role! It can produce higher revenue per can and introduce your service to new neighborhoods. But it may involve more buildup, more customer questions, irregular access, and less predictable scheduling.
Bulk work can also be valuable, especially for filling slower days or creating larger commercial relationships. The tradeoff is usually lower per-can pricing and more project coordination.
A Simple Route-Capacity Formula
Before purchasing equipment or setting aggressive sales goals, estimate your route using these factors:
- Total available work hours
- Average minutes per recurring stop
- Average cans per stop
- Average drive and setup time per stop
- Route density
- Water capacity
- Wastewater capacity and disposal plan
- Number of workdays in the billing cycle
- Recurring versus one-time customer mix
- Expected cancellations and missed bins
- Breaks and maintenance time
Start with available production time, not an imaginary eight-hour cleaning window.
For example:
Completed stops per day = productive minutes available ÷ average total minutes per stop
Then:
Cans per day = completed stops per day × average cans per stop
And for revenue:
Gross route revenue = total cans × price per can
For bulk or commercial agreements, calculate the project separately. Some commercial customers price by container, location, project, or service frequency rather than using a standard residential rate.
Your Real Capacity Is the Lower of Your Water Ceiling or Time Ceiling
Here’s the thing: your real production capacity is usually not just about houses per day. It is about which limit you hit first!
In most cases, your practical bottleneck is the lower of:
- Your water ceiling
- Your time ceiling
If one of those runs out first, that becomes the cap on the route.
Water ceiling
A simple planning version looks like this:
Water ceiling = usable clean-water capacity ÷ average gallons used per can ÷ average cans per stop
Example:
- 500 gallons of usable water
- 5 gallons used per can
- 2 cans per house
That gives you:
500 ÷ 5 ÷ 2 = 50 houses
That is a simple water ceiling example before considering reserve capacity, wastewater capacity, refill access, route conditions, or actual water usage.
And just to be crystal clear, a 500-gallon tank example is not a recommendation for every system. It is only a math illustration. You should always plan from your actual equipment specifications, operating method, and route conditions.
Time ceiling
A simple planning version looks like this:
Time ceiling = available working minutes ÷ (average service minutes per stop + average travel/setup minutes per stop)
Example:
- 480 available working minutes in an 8-hour day
- 7 minutes of service time per stop
- 5 minutes of average travel/setup time per stop
That gives you:
480 ÷ 12 = 40 stops
That is your simple time ceiling for that example.
The lower ceiling wins
This is the part many new operators miss.
- You might have enough water for 50 houses, but only enough time for 40 stops.
- You might have enough available time for 45 stops, but only enough water or wastewater recovery capacity for 30–35 before you need to break the route.
So what is your real route capacity in those examples? The lower number!
That lower ceiling becomes the practical bottleneck for the day.
Water can sometimes be refilled, and that absolutely helps. But refill time, refill location, source availability, wastewater handling, and route interruption all need to be included in the calculation. Otherwise, you are kidding yourself on production planning.
And in the real world, capacity is often constrained by more than just water and time. Wastewater capacity, staffing, and handling capacity can become bottlenecks too, especially on bigger commercial or bulk jobs.
That’s why production capacity is not just a houses-per-day problem. It is a route and resource-capacity problem.
Anonymous Real-World Operator Perspective
The following field observations are anecdotal examples only. They are not specifications, promises, or guarantees. Real output depends heavily on route density, workday length, equipment, number of cans per stop, water access, and wash-bay conditions.
Just as important, these observations come from established cleaning operators, including operations running multiple trucks and even more than five trucks. They are not coming from brand-new startups, internet guesswork, or theoretical estimates. We are keeping every contributor anonymous on purpose, but the value here is that these are experienced-operator benchmarks from people who have actually done the work at scale.
That said, these are the kinds of real-world operator perspectives that help you think more clearly about route planning:
- Around 45 residential stops can already create the pucker factor and feel like a demanding day when the route is not tightly clustered. That number is most realistic when drive time is limited and stops are concentrated in nearby neighborhoods. It is a useful reality check for planning, not a hard limit.
- Some experienced operators have completed approximately 60–70 stops in a 10–12 hour day, depending on the route structure, equipment, and service mix. But let’s be honest: that is a long workday, and it should not be treated like a standard eight-hour expectation. It reflects an extended, highly efficient day, not a promise.
- A wash-bay operation may complete approximately 350 bins in a shift, but wash-bay production is not directly comparable to mobile residential route production because driving, curbside setup, and neighborhood travel are largely removed.
- Depending on recurring service, equipment capacity, number of cans per stop, and route conditions, one tank may support approximately 30–45 stops in some operating situations. With an intermediate refill or disposal opportunity, an operator may complete approximately 25–35 stops per segment, sometimes completing two segments in a day.
Again, these are field examples from experienced operators, not equipment specs.
Why does that matter so much? Because even experienced multi-truck operators do not use one universal cans-per-day number. They plan around:
- Route density
- Workday length
- Service mix
- Tank capacity
- Water usage
- Wastewater capacity
- Physical workload
Two operators can both say they had a “big day” and mean completely different things:
- One may be talking about a dense recurring route
- Another may be talking about a long mixed-service day
- Another may be working from a wash bay with minimal drive time
- Another may be limited mainly by water and wastewater turns, not cleaning speed
That’s exactly why we recommend tracking your own route numbers instead of chasing generic online claims. Real capacity lives where your route design, tank planning, travel pattern, actual service times, physical pace, and average cans per stop meet in the real world.
And remember, the pricing model affects more than billing. It also affects revenue per stop, revenue per can, and workload planning. A 45-stop route is not always the same amount of cleaning work. It could be 45 cans, 70 cans, or up to 90 cans depending on household quantities and how the route is built.
That also ties directly into revenue planning. Many serious operators build their route goals around approximately 35–40 stops per day, because that can be a realistic target range for production and revenue without automatically assuming an extreme pace. At the same time, higher average revenue per stop may pair with fewer stops, which is why a 25-stop day at a stronger average ticket can still be a very solid route. Once you push into 45+ stops, physical strain can increase in a hurry unless the route is tightly clustered and highly efficient.
Quick Ways to Optimize Production Capacity
If you want to improve output without just guessing, focus on these levers:
- Reduce drive time through better route density
- Increase average cans per stop where possible
- Standardize service time and operator workflow
- Schedule next-day or hybrid routes to improve consistency
- Choose equipment capacity around the route, not just the biggest advertised number
- Plan refill and disposal points ahead of time
- Use a wash bay when the job type makes sense
- Track actual gallons per can and actual minutes per stop
That is where real improvement happens!
Route Type Comparison
| Route type | Typical timing considerations | Pricing reference | Strengths | Planning cautions |
|---|---|---|---|---|
| Monthly recurring | Approximately 3–5 minutes for a standard recurring stop; varies by cans and access | $25–$40 per can | Predictable, repeatable, route-friendly | Missed bins, cancellations, customer access |
| Quarterly recurring | Similar standard cleaning, but buildup may vary between visits | $40–$65 per can | Higher ticket per cleaning, recurring revenue | Longer interval may mean heavier soil |
| One-time residential | Often 2–5 minutes longer than a recurring stop | $50–$120 per can | Higher revenue per can | More buildup, access issues, irregular demand |
| Bulk or yard cleaning | Project timing depends on staging, volume, water, and wastewater | $8–$15 per can | Large project potential, fills route gaps | Lower per-can pricing and project logistics |
How Equipment Affects Daily Production
Equipment absolutely matters: but the fastest wash head in the world cannot solve a scattered route!
Your system should match your route goals and expected workload. Important considerations include:
- Fresh-water tank capacity
- Wastewater recovery and holding capacity
- Single versus dual-bin lifting
- Wash speed and pressure
- Hot-water performance
- Equipment layout
- Hose and hose-reel placement
- Lifting range for different container sizes
- Reliability and ease of maintenance
- Downtime and refill requirements
A single-bin setup may be a smart, economical starting point. A dual-bin system may improve production when customers commonly have multiple cans and your route density supports it.
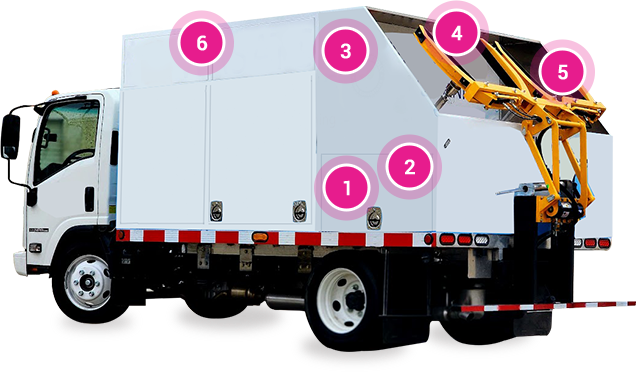
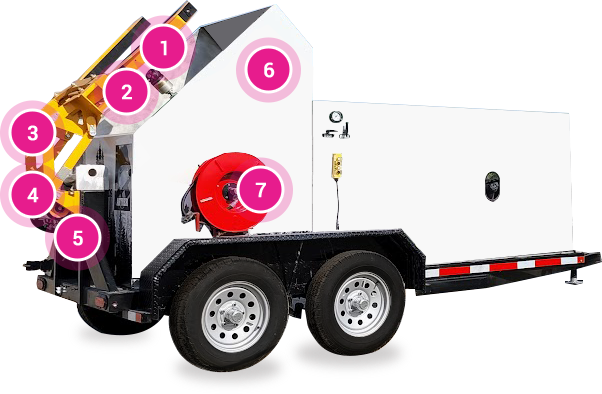
Viking Upfit offers truck, trailer, skid, single-bin, dual-bin, and custom configurations. We can help you compare the options based on your territory, service mix, route goals, and budget: not just sell you the biggest machine available.
Explore Viking Upfit trash can cleaning equipment or review our truck and trailer options.
Use Software to Make the Route More Reliable
The simplest business model is usually the strongest:
- Bill customers upfront or automatically
- Schedule cleanings for the day after waste collection
- Send automatic reminders
- Keep customers grouped by neighborhood
- Track cans and stops
- Document missed or inaccessible bins
- Measure revenue per route hour
Next-day scheduling generally gives you more control than waiting for the waste hauler to finish on the same day. You can start earlier, build a more linear route, and avoid sitting around for a collection truck.
Software such as Jobatory can help automate scheduling, routing, billing, customer notifications, recurring service, and field updates.
That means fewer unpaid accounts, fewer forgotten reminders, and less time chasing customers. That’s a no-brainer!
Track Your First 30–60 Route Days
Your initial estimate is only a starting point. Your own data will become much more valuable after 30–60 route days.
Track:
- Stops per hour
- Cans per hour
- Average cans per stop
- Drive time
- Setup time
- Cleaning time
- Revenue per hour
- Revenue per route day
- Cancellations and missed bins
- Water usage
- Wastewater volume
- Maintenance downtime
- Customer retention
If you discover that your route produces 35 cans but requires six hours of driving, the solution may not be a bigger machine. You may need tighter service zones, better pricing, or a different route day.
The goal is to improve the entire system!
The Bottom Line: Focus on Revenue per Route Hour
So, how many trash cans can you clean in a day?
For a normal mobile residential route, many legitimate operators plan around approximately 35 stops per day, with 35–40 stops being a common serious target range when the route and pricing support it. A spread-out route may produce less. A one-time-heavy day may produce fewer stops but more revenue per can or per stop. Once you get into 45+ residential stops, the day can become physically demanding unless the route is extremely dense and efficient.
Bulk projects are different. A bulk job may involve 100 cans, 1,000 cans, or even 10,000 cans, but that does not mean those totals reflect one ordinary residential route day. Bulk-job math is based on cans, project pricing, staffing, handling, water, wastewater, and schedule planning.
These are illustrative planning ranges: not guarantees.
The bigger takeaway is this: production capacity is not just a houses-per-day problem. It is a route and resource-capacity problem. Your real output is shaped by route density, average cans per stop, actual minutes per stop, refill opportunities, wastewater handling, physical workload, staffing, handling capacity, and whether your water ceiling or time ceiling hits first.
That is also why you need to think in both stops and cans. A route may look modest on paper at 45 stops, but the real workload and revenue picture changes fast if those stops average 1 can, 1.5 cans, or 2 cans each.
Even experienced multi-truck operators do not rely on one universal cans-per-day number. They plan around the actual route, the actual workday, the actual tank capacity, and the actual service mix. That is why the 35–40 stop range is a realistic target many serious operators plan around, while also recognizing that higher revenue per stop may come with fewer total stops. The 45-stop observation is best used as a planning reality check, and 60–70 stops should be understood as an extended, highly efficient day rather than a normal expectation.
The best trash can cleaning business usually builds a dense recurring customer base first, then uses one-time and bulk work strategically. Focus on route density, reliable software, upfront billing, sensible service areas, and the equipment capacity required for your market.
If you’re ready to compare equipment and build a practical route plan, book a free consultation with Viking Upfit. We can help you think through equipment, scheduling, software, wastewater handling, financing, and the day-to-day realities of starting a bin cleaning business!
You can also see our Google reviews and connect with other operators in the Bin Cleaners Network Facebook group.
Talk Trash With Us!
- Website: VikingUpfit.com
- Phone: 210-971-4980
- Email: clean@thetrashcancleaners.com
- Facebook group: facebook.com/groups/bincleanersnetwork
Disclaimer: The figures in this article are illustrative industry examples for general education. Actual production, pricing, revenue, costs, permitting, water use, wastewater requirements, and business results vary by market, equipment, route density, labor, weather, and operating practices. Gross revenue is not profit. This article is not financial, tax, legal, or accounting advice. Consult qualified professionals before making business or investment decisions.